You are using an out of date browser. It may not display this or other websites correctly.
You should upgrade or use an alternative browser.
You should upgrade or use an alternative browser.
KD Trades
- Thread starter Kooyar
- Start date

Kooyar
TFG Forum Junkie
This time I am going ahead with sell position on USD/CAD. My understanding from the WTI weekly & monthly charts are that the oil price looks like to increase further ( To 60$ may be).
Looking at the USD/CAD monthly chart also suggests that there is a bearish trend in effect.
At this moment, I'm thinking that USD/CAD is going to hit 1.2000. Will see how the price will move next week. I have set the stop loss at 1.3220.
Let me know guys your thoughts on this trade.


Looking at the USD/CAD monthly chart also suggests that there is a bearish trend in effect.
At this moment, I'm thinking that USD/CAD is going to hit 1.2000. Will see how the price will move next week. I have set the stop loss at 1.3220.
Let me know guys your thoughts on this trade.
Kooyar
TFG Forum Junkie
My USD/CAD positions are yet open. See my updates below;
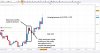
The first screenshot shows the current CAD/JPY monthly chart which supports an up-trend pattern.
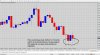
The next chart is for WTI crude. I've selected the daily chart to show that there is a good possibility for an up-trend on WTI price in the coming days which ultimately supports falling the price on USD/CAD.
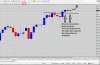
And finally, I've selected the weekly chart of USD/CAD to show that we need to see some sort of price reversal candle this week. The current weekly chart on USD/CAD yet does not suggest a down trend.
So, I think this week is an exciting week to see how the market will move.
The first screenshot shows the current CAD/JPY monthly chart which supports an up-trend pattern.
The next chart is for WTI crude. I've selected the daily chart to show that there is a good possibility for an up-trend on WTI price in the coming days which ultimately supports falling the price on USD/CAD.
And finally, I've selected the weekly chart of USD/CAD to show that we need to see some sort of price reversal candle this week. The current weekly chart on USD/CAD yet does not suggest a down trend.
So, I think this week is an exciting week to see how the market will move.
Attachments
Kooyar
TFG Forum Junkie
I found a sell position on NZD/JPY worth to be considered as it might bring potential R/R ratio of 1:16.
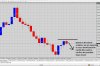
The monthly chart shows the market pushes the price lower however, it is clear that there is a support on the way.

Now, if we look at the weekly chart, we can see a bear market with lower highs and lower lows. It looks like that the price has already broken the mentioned support. It's clear that in the last 6 weeks, price could not hold above the drawn line shown in the below screenshot.

We can see breaking of the above mentioned support on the daily chart also;

Looking at the 4H chart, a range market can be seen. As the price is close to the high of the range then, a sell position is justifiable.

The monthly chart shows the market pushes the price lower however, it is clear that there is a support on the way.
Now, if we look at the weekly chart, we can see a bear market with lower highs and lower lows. It looks like that the price has already broken the mentioned support. It's clear that in the last 6 weeks, price could not hold above the drawn line shown in the below screenshot.
We can see breaking of the above mentioned support on the daily chart also;
Looking at the 4H chart, a range market can be seen. As the price is close to the high of the range then, a sell position is justifiable.
Last edited:
NZD/JPY hit its stop-loss after RBNZ news. Although I had set the stop-loss of the position at -60 pips but, it was closed at -160 pips after the news. I am not sure why did it happen!!!
Also, I decided to close the USD/CAD positions with total of + 320 pips.
contact your broker and report it,they will give refund.
Kooyar
TFG Forum Junkie
I had a sell position on GBP/USD which could have been closed with 160 pips but, as I didn't exit at the right time, this position closed at break even. I found it worth to share. As it is shown below, a price rejection pattern had been developed which I did not pay attention to and lost all the profit on this trade !!!!

Kooyar
TFG Forum Junkie
This time, there was a very quick rally in GBP/JPY which I decided to exit the trade with R/R ratio of 1/8.
The strength of the bullish candle was even very clear in H1 chart. I used H1 chart for entering to the trade and H4 chart for making the final decision to close the position.


In the daily chart however, it does not look like the bullish trend is finished at this moment but, I decided to exit at this point as have already made a sound profit and didn't want to put this profit at risk.

The strength of the bullish candle was even very clear in H1 chart. I used H1 chart for entering to the trade and H4 chart for making the final decision to close the position.
In the daily chart however, it does not look like the bullish trend is finished at this moment but, I decided to exit at this point as have already made a sound profit and didn't want to put this profit at risk.
Kooyar
TFG Forum Junkie
I am going to share two of my current open trades.
The first one is a long position on GBP/JPY. I decided to open this position with understanding of the fact that the BOE is going to announce the interest rate decision today which can introduce more risks to this trade but I have tried to set a tight stop loss as much as I could. As I mentioned in my previous post, the daily chart supports the uptrend. A strong bullish candle that appeared in H4 chart was a good reason in my opinion to enter to this position with a risk of losing 17 $.

The next position is a short position on USD/CAD. The reasons that I've opened this position is quite similar to the other one. The daily chart shows a bearish trend. My strategy to enter to this trade was appearance of a strong bearish candle in H4 chart. Have put 13$ at risk for this trade.

I'll post the outcomes once they are closed.
The first one is a long position on GBP/JPY. I decided to open this position with understanding of the fact that the BOE is going to announce the interest rate decision today which can introduce more risks to this trade but I have tried to set a tight stop loss as much as I could. As I mentioned in my previous post, the daily chart supports the uptrend. A strong bullish candle that appeared in H4 chart was a good reason in my opinion to enter to this position with a risk of losing 17 $.
The next position is a short position on USD/CAD. The reasons that I've opened this position is quite similar to the other one. The daily chart shows a bearish trend. My strategy to enter to this trade was appearance of a strong bearish candle in H4 chart. Have put 13$ at risk for this trade.
I'll post the outcomes once they are closed.


Kooyar
TFG Forum Junkie
Here is my open position on GBP/JPY.

I have not closed the position yet because of the fact that a bullish candle is appeared in the daily chart which may suggest the continuation of the uptrend. So, I'll keep an eye on this trade with a goal of increasing the R/R ratio.

I have not closed the position yet because of the fact that a bullish candle is appeared in the daily chart which may suggest the continuation of the uptrend. So, I'll keep an eye on this trade with a goal of increasing the R/R ratio.