
You are using an out of date browser. It may not display this or other websites correctly.
You should upgrade or use an alternative browser.
You should upgrade or use an alternative browser.
Divergence Trading
- Thread starter joffie
- Start date
G
gauri
Guest
Hello, Divergence is a potent tool that is imbedded inside of oscillators that can be used to spot potential market reversals by comparing an indicator with market direction.
erebus
TFG Forum Legend
jonathanleger
Casual Member
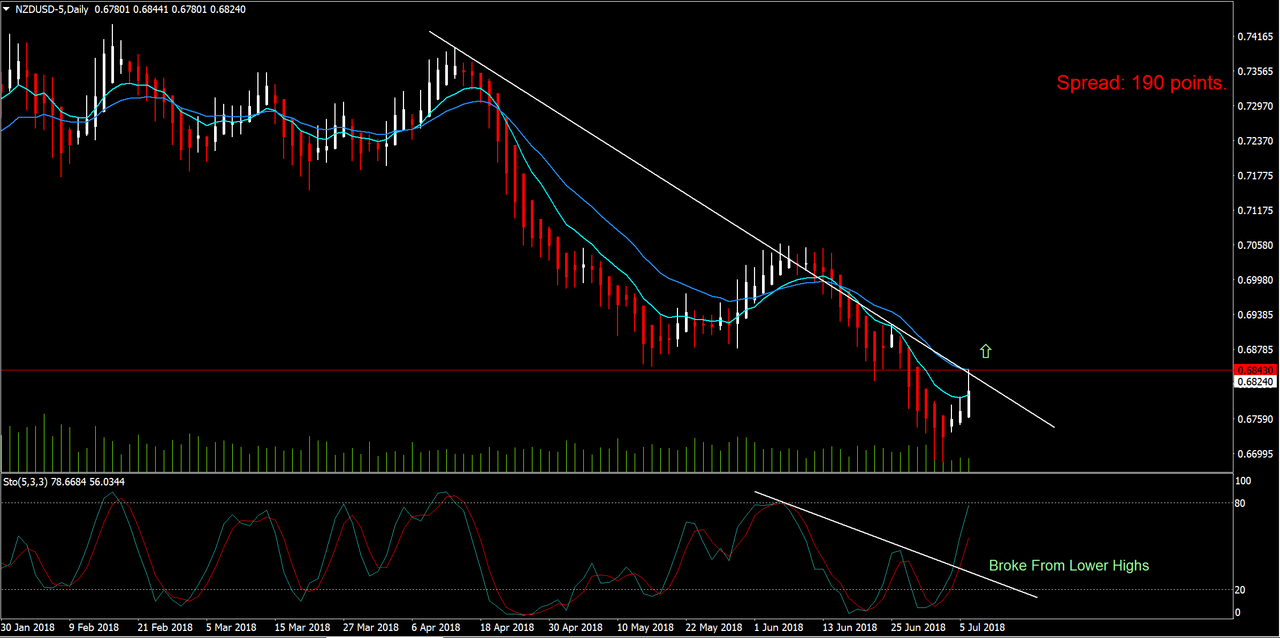
Here's a good one on NZDUSD 1D. The Heikin Ashi chart shows that it's just starting the trend, and the divergence pattern shows that it's not just a correction but a trend change. The 4H shows the pair is overbought, though, so you'll want to wait for a good entry point.
Last edited:
jonathanleger
Casual Member
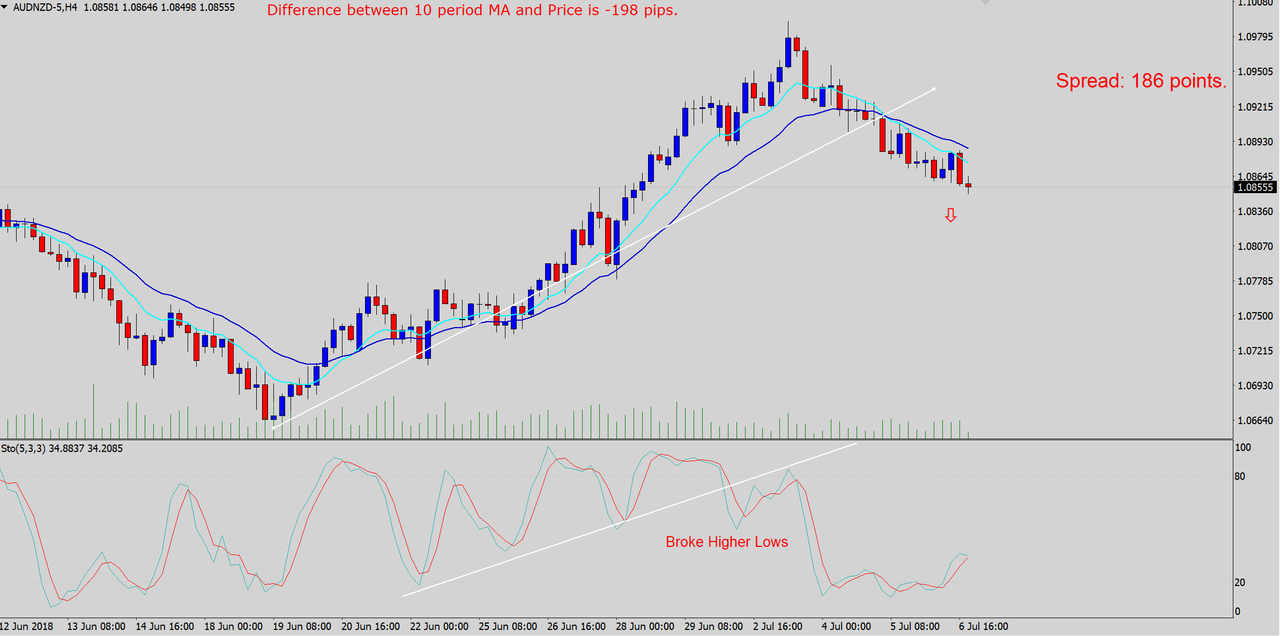
Another one (AUDNZD 4H):
jonathanleger
Casual Member
EURNZD H1. Major divergence signaling a turn-around after 3 days of declines:
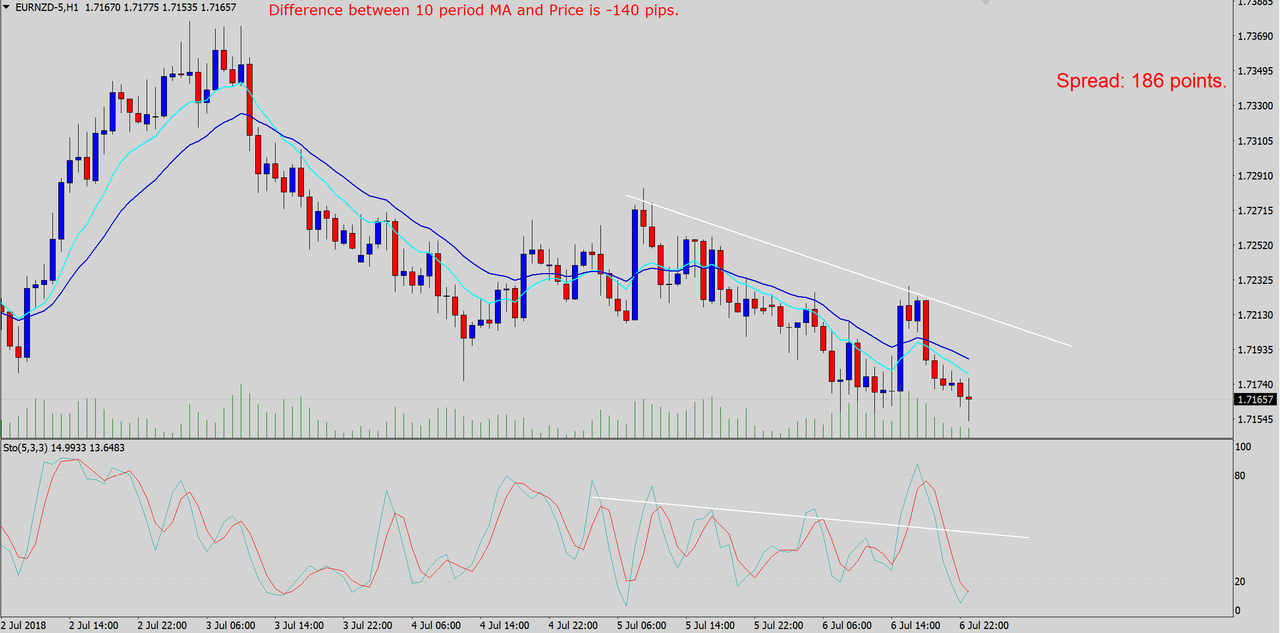
The H1 stochastic shows oversold and just ticked up.
The M30 Heikin Ashi chart shows a long double-wicked candle at the end, signaling an immediate change:
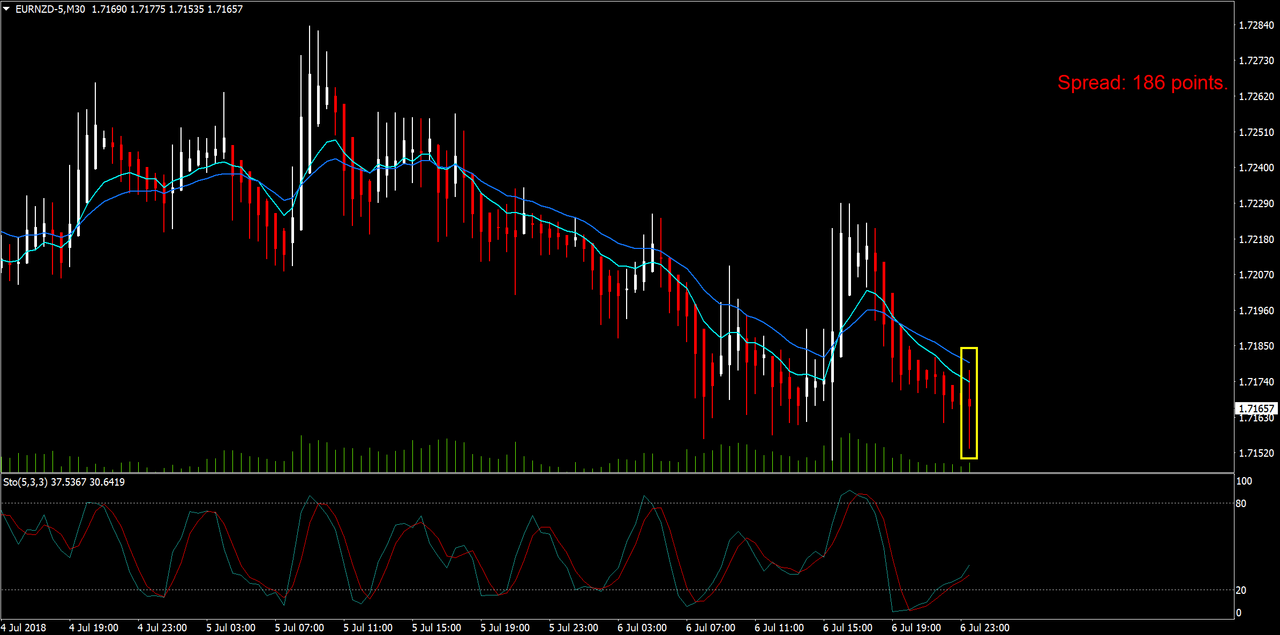
Dale has a great article on Heikin Ashi in case you aren't familiar with it:
https://www.theforexguy.com/guide-to-heikin-ashi-candles/
This one looks a little risky though because the fall of the USD due to the NFP report yesterday drove that last high and if that doesn't hold the up-swing may not last. The stochastic low on the D1 hasn't formed yet so it's inconclusive. May be best to wait until that happens on the D1 before acting on this one.
The H1 stochastic shows oversold and just ticked up.
The M30 Heikin Ashi chart shows a long double-wicked candle at the end, signaling an immediate change:
Dale has a great article on Heikin Ashi in case you aren't familiar with it:
https://www.theforexguy.com/guide-to-heikin-ashi-candles/
This one looks a little risky though because the fall of the USD due to the NFP report yesterday drove that last high and if that doesn't hold the up-swing may not last. The stochastic low on the D1 hasn't formed yet so it's inconclusive. May be best to wait until that happens on the D1 before acting on this one.
Last edited: