DOUBLE INSIDE DAYS Signal

faridsucre

Forum Newbie
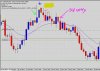
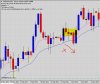
Hello everyone! Farid here. ANw, I recently have been studying the charts and I found out something about this Double Inside Bars forming in charts. Recently it appeared in the EUR/USD and the USD/CHF.

I spotted something about it, and decided to study the previous dates and test out other currencies as well. My discovery is that, it turned out that Double Inside Bars can be useful as a REVERSAL SIGNAL. :)
From what I see, it looks that it is a reversal signal or maybeee it is just an inside day signal, but I'm gonna share it anw haha. This is not a system or anything about fancy indicators. What I am sharing is about the knowledge I have learnt from protocol, and found a discovery about double inside bars which is very helpful. This is only for educational purposes.
However, in Price Action trading, confirmation is key to everything.

So I am here to share the knowledge I have learnt to all war room members. I'll update soon about it.
Also, I wanted the members opinion about this method I am going to show and hopefully we crack something out of it
and solve the puzzle behind this Double Inside Bars :D :idea:
 

faridsucre

Forum Newbie
The RULES

Okay so I am going to show an example.
Rules for Double Inside Days reversal signals to be valid:
1. Check for Trend Market Condition. Does the Double Inside Days candle formed during UPTREND or DOWNTREND?
2. Double Inside Days must be AWAY from mean value. Good mean reversion signal like we learnt in the protocol.
3. DO NOT straight away claim that it is a reversal signal. Confirm it by waiting for other candlesticks to form.
(SAY 2 to 4 candles formed)
4. If there is a rejection candle formed afterwards or any PA signal like power candles, its also a good sign.

So now, for an UPTREND condition, the reverse will be downtrend. Once Double Inside Days formed, check if its away from the mean. Maybe not too far could also be valid. Check with candlesticks forming afterwards for confirmation, 2 to 4 candles. Do not include the candle formed after the double inside days.

For an Uptrend condition, if candlesticks body forming afterwards are below the double inside days, its a high probability that reversion will occur.

For a Downtrend condition, if candlesticks body forming afterwards are above the double inside days, its a high probability that reversion will occur.

Confirm again with rejection candles or PA signal such as power candles. Its a good sign. :)
When you have made confirmation, enter on a rejection candle/Pa signal or retracement entry.
You guys can try this method and try it out by studying previous days charts on different currencies.
Oh yes, for me I only use it on Daily Timeframe.
So yeah thats all heh. Hope to hear some opinions from other members, or maybe if you notice something on this signal do tell me aiteeeee~
 

faridsucre

Forum Newbie
USDCHF example

Blue arrow: Shows that Double Inside Days have formed.
Red Ticks: Confirmation that candlesticks afterwards formed below the Double Inside Days since its a UPTREND condition.
So the reverse will be a downtrend.
Yellow Highlighted: Notice that no candlesticks body formed inside this yellow box, which means that it is not a false signal. If candlesticks body filled in here, it means that it is false signal since the body is above the double inside days.

Green arrow: Looks like Bearish rejection candle formed even before the double inside days. Also a good signal that market is going downwards.

Pink arrow: After you have done your confirmation, you can enter the trade at the 50% retracement entry.

So yup this is one of the example just happened on USDCHF market recently. :)
 

Attachments

  • NEW.JPG
    NEW.JPG
    77.6 KB · Views: 181

faridsucre

Forum Newbie
USDCHF false signals

An example of USDCHF false signal would be this.
1) its an UPTREND market condition. So we expect it to reverse downtrend.
2) Double Inside Days formed, body is above mean value.
3) However candlesticks forming afterwards filled inside YELLOW box.
Candlesticks forming are above the Double Inside Days.
Therefore, its a FALSE reversal signal. It tells us that the market is still trending upwards since candlesticks forming filled in the upper yellow box.

Anw guys this is only for educational purposes. I just wanted to share my discovery about the studies we learnt from protocol, the Inside Days trading. Which is what I have discover from the Double Inside Days. It can be powerful when confirmations are done properly :)
 

Attachments

  • NEW_2.JPG
    NEW_2.JPG
    66.1 KB · Views: 164

squalodon

Regular Member
Re: The RULES

faridsucre said:
Okay so I am going to show an example.
Rules for Double Inside Days reversal signals to be valid:
1. Check for Trend Market Condition. Does the Double Inside Days candle formed during UPTREND or DOWNTREND?
2. Double Inside Days must be AWAY from mean value. Good mean reversion signal like we learnt in the protocol.
3. DO NOT straight away claim that it is a reversal signal. Confirm it by waiting for other candlesticks to form.
(SAY 2 to 4 candles formed)
4. If there is a rejection candle formed afterwards or any PA signal like power candles, its also a good sign.

So now, for an UPTREND condition, the reverse will be downtrend. Once Double Inside Days formed, check if its away from the mean. Maybe not too far could also be valid. Check with candlesticks forming afterwards for confirmation, 2 to 4 candles. Do not include the candle formed after the double inside days.

For an Uptrend condition, if candlesticks body forming afterwards are below the double inside days, its a high probability that reversion will occur.

For a Downtrend condition, if candlesticks body forming afterwards are above the double inside days, its a high probability that reversion will occur.

Confirm again with rejection candles or PA signal such as power candles. Its a good sign. :)
When you have made confirmation, enter on a rejection candle/Pa signal or retracement entry.
You guys can try this method and try it out by studying previous days charts on different currencies.
Oh yes, for me I only use it on Daily Timeframe.
So yeah thats all heh. Hope to hear some opinions from other members, or maybe if you notice something on this signal do tell me aiteeeee~

Hi farid! thank you for your observation. i also have observed the same thing. would you like to compare notes?

Do you have yours written down on ms word or notepad? i can send you my file.

what i notice is that inside days-indecision candles appear most of the time in mean reversion trades

and the part where you said that "in an uptrend after the double inside day the day opens pushing down the chance of mean reversion is high" is actually a rule that i notice

That in mean reversion- it is best when the price retraces to the 50% area of the inside day (like it is stated in the protocol) or the indecision candle and goes towards the mean immediately the next day after it has formed...

(Take note: basically the price action did the same thing when the inside bar retraced to 50% before shooting for the mean and also when an indecision candle closes then next day shoots for the mean.. the price action is the same the cut off period of the time for the candles are different though.. that's why different candle signals)

About the end of a trend.. that one is hard for me.. but i have noticed that inside days and indecision candles do signal the end of a trend.. or somewhat a pause..

i also have noticed that inside days and indecision candles.. CAN signal the beginning of a new trend.

For example:

Price is below mean.. forms a mean reversion signal... you go long.. after going long.. the price penetrates the mean...

and then while the price is above the mean. it forms an inside day or indecision candle just around the mean area.

To Start a NEW trend. or a big Correction.

It's a Rally-- BASE (inside day or indecision candle)- Rally again.

What you notice in mean reversions is a Rally- Base (inside day or indecision candle)- Drop.. move.. this is very helpful actually.

Would you have your notes written down? maybe we can share notes :)
 

faridsucre

Forum Newbie
Re: The RULES

squalodon said:
faridsucre said:
Okay so I am going to show an example.
Rules for Double Inside Days reversal signals to be valid:
1. Check for Trend Market Condition. Does the Double Inside Days candle formed during UPTREND or DOWNTREND?
2. Double Inside Days must be AWAY from mean value. Good mean reversion signal like we learnt in the protocol.
3. DO NOT straight away claim that it is a reversal signal. Confirm it by waiting for other candlesticks to form.
(SAY 2 to 4 candles formed)
4. If there is a rejection candle formed afterwards or any PA signal like power candles, its also a good sign.

So now, for an UPTREND condition, the reverse will be downtrend. Once Double Inside Days formed, check if its away from the mean. Maybe not too far could also be valid. Check with candlesticks forming afterwards for confirmation, 2 to 4 candles. Do not include the candle formed after the double inside days.

For an Uptrend condition, if candlesticks body forming afterwards are below the double inside days, its a high probability that reversion will occur.

For a Downtrend condition, if candlesticks body forming afterwards are above the double inside days, its a high probability that reversion will occur.

Confirm again with rejection candles or PA signal such as power candles. Its a good sign. :)
When you have made confirmation, enter on a rejection candle/Pa signal or retracement entry.
You guys can try this method and try it out by studying previous days charts on different currencies.
Oh yes, for me I only use it on Daily Timeframe.
So yeah thats all heh. Hope to hear some opinions from other members, or maybe if you notice something on this signal do tell me aiteeeee~

Hi farid! thank you for your observation. i also have observed the same thing. would you like to compare notes?

Do you have yours written down on ms word or notepad? i can send you my file.

what i notice is that inside days-indecision candles appear most of the time in mean reversion trades

and the part where you said that "in an uptrend after the double inside day the day opens pushing down the chance of mean reversion is high" is actually a rule that i notice

That in mean reversion- it is best when the price retraces to the 50% area of the inside day (like it is stated in the protocol) or the indecision candle and goes towards the mean immediately the next day after it has formed...

(Take note: basically the price action did the same thing when the inside bar retraced to 50% before shooting for the mean and also when an indecision candle closes then next day shoots for the mean.. the price action is the same the cut off period of the time for the candles are different though.. that's why different candle signals)

About the end of a trend.. that one is hard for me.. but i have noticed that inside days and indecision candles do signal the end of a trend.. or somewhat a pause..

i also have noticed that inside days and indecision candles.. CAN signal the beginning of a new trend.

For example:

Price is below mean.. forms a mean reversion signal... you go long.. after going long.. the price penetrates the mean...

and then while the price is above the mean. it forms an inside day or indecision candle just around the mean area.

To Start a NEW trend. or a big Correction.

It's a Rally-- BASE (inside day or indecision candle)- Rally again.

What you notice in mean reversions is a Rally- Base (inside day or indecision candle)- Drop.. move.. this is very helpful actually.

Would you have your notes written down? maybe we can share notes :)

Hey there Squalodon! :) Thank you for reading my post. That's great that you noticed it too.
Anw, after I've read your reply, I get what you mean haha thanks for sharing.
Yeah kinda noticed it went drop and moved.
Or it looks like after the inside days have formed, it follows the trend. After a long/short trend just say an indecision candle forms again, a trend changing or basically stop and correction. so does that what you meant? Haha I kinda understand, but it would be helpful if you could insert the images about the inside days you said earlier. I think its really great.
Yeah sure, I could send you in ms word haha.
Anw how do I private message you or smth?
 

squalodon

Regular Member
In my opinion it is hard to fit in a "bearish or bullish bias" with these type of clustered patterns

but they they are clustered together like it is said in protocol it makes for a strong breakout or breakdown

a possible trade entry would be breakout of either side.. by putting abuy stop and sell stop when you see these patterns

eurusd-d1-exness-ltd.png


Mean reversion

eurusd-d1-exness-ltd-2.png


Here are a set of clustered patterns.

eurusd-d1-exness-ltd-3.png


In my opinion it does not need to be purely inside days.. it could either be inside days, with indecision candles..

the best clustered patterns are the ones with rejection candles.. this gives us a clue to where it is going? somewhat of course it is still not definite.. but with it you can guess a bit better where it's gonna go. so what happens there is we are basically trading of off the rejection candle.. but with the clustered patterns of double inside days and double indecision candles.. we might want to take our profits a bit earlier.. around 1:3.. since the appearance of these
patterns.. double inside.. and clustered patterns (inside+indecision) could result in a lot of pause movement..

Also when i see patterns like these.. i tend to think the market has stopped trending and is entering a ranging environment

it could be a big range 400-500 pips, or a small range 200-300 pips.. or consolidating 100pips

but all in all that's how i view them.. what is hard to think about is how to make rules for entry and stop losses for them.

Also outside candles.. or fake breakout candles.. are great entries when we get double inside days.

Let my try messaging you. mine is in notepad.. but what i did was more on studying the "goldilocks ratio" for each signal... some have 1:5 some have only 1:2 etc.
 

squalodon

Regular Member
One more observation if you get just one inside day or indecision candle.. it does not mean the trend is ending.. you sort of need 2-3 of them. first..

also notice a rejection candle appeared.. if this happened.. we are basically entering on the rejection candles 50% retracement entry now.. but this could help since we would have a better idea if we should aim for higher TP 1:5 or more..

or the standard 1:3.. since there are lots of clustered patterns forming.

eurusd-d1-exness-ltd-4.png


Also i think clustered patterns like these should have a recommended TP of only 1:3 this should be studied further.. but these are just base on my observations..
 

tjenarvi

TFG Forum Junkie
any updates squalodon?
farid idea is very nice though.. I found it an example on GBPJPY, it is quite strong signal with high probability, thanks farid.
 

Attachments

  • GBPJPYDaily.png
    GBPJPYDaily.png
    29.6 KB · Views: 13
Top