BUY the DIP & SELL the RIP

erebus

TFG Forum Legend
BUY the DIP & SELL the RIP

Have you heard that before?

How about? Trade against the crowd, do the opposite of what everyone else is doing.

As a diehard trend follower and trend trader, I have always had trouble understanding the contrarian concept, let alone being able to sell tops and buy bottoms.

Of course, I know and use ADR indicators and understand that there will be reversals after certain price moves, obviously, it just doesn't go straight up or down forever.

But, in a strong trend, those are normal retracements, which I have trouble trading; I want to be on the main trend direction.

Elsewhere on this forum, I have extolled the virtues of the 4-Bar Fractal Indicator as an excellent signal for entering trades with the trend.

This is not the usual Fractal that you may be familiar with, so the name doesn't really suit as it may confuse people.

The idea is published on Trader Tom's website where he credits the concept to Al Brooks.

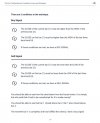
Here are the "rules" or "guidelines" as I like to call them:
2021-08-26_14-11-06.jpg

Here is an example:

2022-03-22_19-41-21.jpg


The dots display where the criteria are met from the rules above; obviously, red for sell and blue for buy.

Works great, so what is the problem?

To be continued...
 

erebus

TFG Forum Legend
Here is an example of how you would use those signals to trend trade, well, it's how I have been using it anyway.

First, find the trend on a higher timeframe; here the Daily trend is visually down, and below the 20 EMA.

Then move to the 4-Hour where the trade(s) can be entered on each signal.

The stop loss and take profit are up to individual traders according to their risk profile and money management plans.

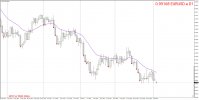
2022-09-05_10-37-01.jpg2022-09-05_10-38-10.jpg

As we can see, the last 2 weeks have been flat and left many open positions; the week before that generated winning trades for sure.
 

erebus

TFG Forum Legend
So, on to my revolutionary idea to take the opposite signals and still be with the main trend.

My plan is to show only the Buy signals on the 4-Hour chart but in RED not the usual blue color.

Here is the same chart as above, with that setting.

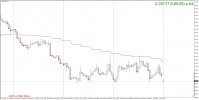
2022-09-05_10-50-19.jpg

Not the best example, but you should be able to see that if those signals were all opened, they would ALL be in profit at today's price, a surprisingly good result for a Monday opening.

So, I will be experimenting with this idea for a few weeks, on the twenty-eight pairs, using a Take Profit of 1 x ADR and Stop Loss of 2 x ADR and ridiculously small positions only.

Please, as always, your thoughts, comments, suggestions, and criticisms are always welcomed.

:)
 

erebus

TFG Forum Legend
A week has passed, and I didn't place any positions on the demo account for testing.

On reflection, I have made two changes:

1. I will use the indicator FX Trend to determine the trade direction. When the Weekly and Daily are in alignment, take the 4-Hour signals.

2. Rather than place and hold many positions with no obvious exit, I will use 0.5 of the ADR to Take Profit. The idea being that the result will be many wins with smaller profits of course.

Example charts to be posted.
 

erebus

TFG Forum Legend
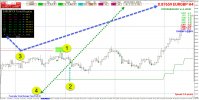
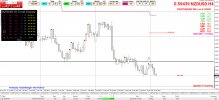
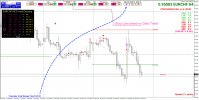
Here is an obvious example on the daily chart; note the following points:

1. The price on Daily breaks the FX Trend level on 12 August 2022, see the green highlight "1". As it does so often, price retreats immediately.

2. Point "2" showing the date, compare this with the 4-Hour chart to follow.

3. With this indicator, by clicking and highlighting the " x " this locks it to the user desire and current time frame of the chart, in this case Daily. Also, we will reference this on the 4-Hour chart.

2022-09-19_9-40-32.jpg
 

erebus

TFG Forum Legend
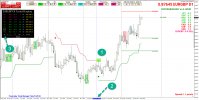
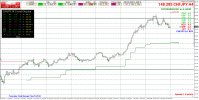
Moving on to the 4-Hour chart to the point of interest of August 12, 2022.

1. Again, the reference to the green highlight at the break of the price level noted on the Daily chart, see the FX Trend line has been held to that level. Also, the vertical line for the date.

2. The first (obscured) of many green dots representing sell signals from the 4-Bar Fractal indicator, which we are taking as Contrarian buy signals because they are the Dips.

3. Point "3" showing where to confirm the locked " x " of the Daily level and then the actual chart being on the 4-Hour.

4. I have set the EA to exit the trades on 0.5 of ADR which I generously rounded down for ease of calculations. Here we have an ADR of 63 rounded to the Take Profit of 30 pips. The ultimate exit is the lower green line level of the FX Trend Daily indicator. As you can see, each entry easily makes the 30 pips profit as price continues the major uptrend direction. I counted 14 dots, making a total of 420 pips.

I guess` that timing would make a dramatic difference in the success or failure of this method. Say if right now, all pairs decide to make a change of the major trend, then all these many small entries would be caught on the wrong side, and it takes a long time to then establish the alignment of both weekly and daily directions again.

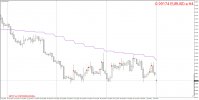
2022-09-19_9-44-10.jpg
 

erebus

TFG Forum Legend
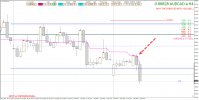
To illustrate the last point of last post, most of the JPY pairs are retracing the long uptrend they have enjoyed but not quite reversed direction according to the FX Trend indicator at least.

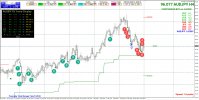
Here is how I see the recent price action of the AUDJPY; previous weeks have a total of 11 signals giving a harvest of 60 by 11 = 660 pips.

Last week, there were a further 10 signals of which only 2 (blue arrows) moved the requisite 60 pips for a profit exit leaving 8 entries undecided this Monday. The rough estimate is a negative 850 pips if price dropped to the FX Trend line which would result in a net loss of about 70 pips, not losing the account but trend continuation would be nice.

2022-09-19_10-16-01.jpg
 

erebus

TFG Forum Legend
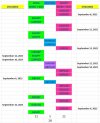
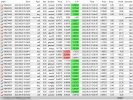
I made this table to track the main 28 pairs as a quick reference, track changes, and also to have an overall view

For instance, all the JPY pairs are in agreement at present, they are all in Buy mode, confirming that the YEN is weak.

And the CHF pairs also, being in Sell mode confirming a strong Franc.

With those 2 currencies, we can see the trend that developed into almost 1,000 pips move since early August.

This is causing a conflict with USD as USDCAD, USDCHF and USDJPY are not in agreement.

2022-09-19_10-36-37.jpg2022-09-19_10-44-27.jpg
 

erebus

TFG Forum Legend
Here is the first winner to report, the signal was from Last Friday and the entry way too late, but I had the need to trade something

2022-09-19_19-49-52.jpg
 

erebus

TFG Forum Legend
RULE 1 - BUY PULLBACKS, NOT BREAKOUTS! or SELL RALLYS, NOT BREAKOUTS

Rule 2 - Buy the Market After It's Dropped; Not After It's Risen or Sell the Market After It's Risen; Not After It's Dropped

Rule 3 - Buy Above The 200-Day Moving Average, Not Below or Sell Below The 200-Day Moving Average, Not Above

Taken from "Short Term Trading Strategies That Work" by Larry Connors and Cesar Alvarez

Buy the Fear, Sell the Greed
 

erebus

TFG Forum Legend
This week's results, I thought there would be more signals, I certainly didn't catch them all.

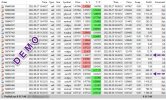
Total of 29 entries made, 3 stopped out, 1 closed out late Friday for small loss to be flat, 28 winners

So, using 25 winners from 28 = 89% strike rate

No risk management used for position sizing, just fixed size of 0.05 to prove the theory

EDIT: Actually, I closed the EURNZD manually for breakeven, so basically only 2 losers;

recalculation = 25 winners from 27 = 93% strike rate

2022-09-23_23-55-50.jpg
 
Last edited:

erebus

TFG Forum Legend
An update for my trend table; most notable changes:

All JPY pair have moved to a neutral stance due to BoJ invention to strengthen the YEN

GBP pairs moved to bearish trend due to various fundamentals, e.g. interest rates and inflation

2022-09-24_11-29-13.jpg
 

erebus

TFG Forum Legend
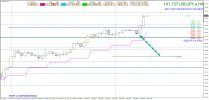
These are some typical trades, 1st was taken from the Friday signal as shown by the down arrows.

The " X " was a missed signal. Obviously, with the record volatility in the FX market this week, larger take profits or hold longer would increase the gains.

You can see that the ADR has increased, and adjustments must be made for the current calculation for TP.

2022-09-24_11-38-43.jpg
 

erebus

TFG Forum Legend
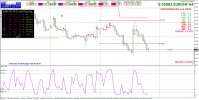
Here is the same chart with the RSI (2) added, quite an analysis method!

Really great confirmation for the pullback entries that I am testing.

2022-09-24_19-48-13.jpg
 

erebus

TFG Forum Legend
Mid-week update: and what a week it has been so far, huge gyrations in the GBP pairs.

I increased the lot size, these are closed so far, and opened another tranche of positions on Thursday.

2022-09-29_10-35-16.jpg
 

erebus

TFG Forum Legend
A great week closed 2 positions manually and still positive results with the increased lot sizes.

I need to research this further; I'll be busy doing more analysis with a focus on 1-Hour entry for these volatile pairs.

2022-10-01_7-23-45.jpg
 

erebus

TFG Forum Legend
Okay, so I've gone off this a little bit.

1 - It's challenging work, but it helped my reading of price action greatly

2 - I'm more interested in the Larry Williams 9-EMA strategy on daily charts

Standby for my thread on that
 

erebus

TFG Forum Legend
I will be revisiting this strategy beginning next week, who's with me? :)

Parameters and an example below -

Establish a trend bias on Weekly & Daily charts using 5 EMA and 12 EMA

Enter on the 4-Bar Fractal signal opposite to the trend

Use 1 x ADR(10) for Stop Loss and Take Profit at 1% risk

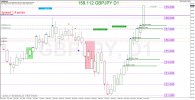
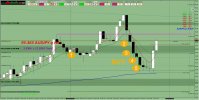
#1 was a potential entry from the previous week, 2, 3, 4, 5, definite entry this week, ADR(10) is 73 so #5 at TP now.

2023-09-22_17-52-41.jpg
 

erebus

TFG Forum Legend
I have been reviewing the past week; my thoughts now are, limit each pair to 4 entries at 0.25% for a total of 1% per pair. Also, I will use ADR(10) as the Stop Loss and Take Profit.

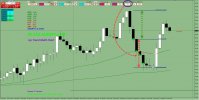
Using the above chart example, here is how I see the 1st entry marked as #2 on that chart, it is stopped out.

2023-09-24_12-05-13.jpg

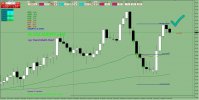
The next 3 entries would be winners as shown here:

2023-09-24_12-14-08.jpg

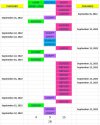
I examined all 4-Bar fractal signals and was surprised by the results, here is my Excel sheet, still 2 trades would be open. The "C" plus number, e.g. C19 means the 19th candle of the week; there are 30 x 4-Hour candles in 1-week.

2023-09-24_12-15-21.jpg
 
Top