joffie
TFG Forum Junkie
Hi Guys,
I've finally had a little time to post this method, sorry about the delay. First off let me say this is not my method and I have learnt this from another trader. I am going to show you the basics of how to trade this method and what to look for with both EU and GU charts from last weeks trading. Now this is a day trading method and requires your attention from 8am London open until end of the day New York close if you are holding trades this late into the day. Some trades will be left over night but mainly are closed out the same day. We only trade these 2 pairs as they are the most active during these hours.
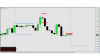
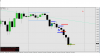
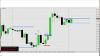
This method will required for you to hedge your position on some trades, this means we have tried to sell or buy at the low or high of the day and have got it wrong and price reverses against our entry. Here we are looking to recover our loss at best and get some profit along the way. In most cases you win more on your hedge position than your losing trade. But with every thing forex there is a risk of having both trades stopped out, which has happend a couple of times to me.
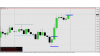
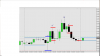
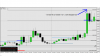
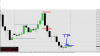
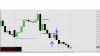
So we mark the high and low of the asian session range and look for price to make a new high or low of the day with a opposite candle. We are then looking for price to make a new high or low in the opposite direction for a profit, but on some occasions this will need to be hedged if we dont have the high/low of the day.
Once in a trade on the first reversal candle if in profit we move our stop to break even to protect the account. Then let the profit run and lock in more as price moves. I will leave this up to you how you manage your take profit targets, either a fixed or let it run. I personally will lock in a 1:2 as soon as a 1:3 has been hit and let the trade run.
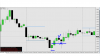
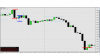
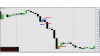
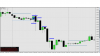
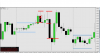
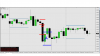
Below are trades from last week using this method, any questions just let me know.
joffie
Added rule that I use is not to trade into or touching a round number, the best trades come when traded with room or bouncing off or near a round number . If I now trade near a round number I will move to break even once hit or breached rather then waiting for a reversal candle if in profit of course, other wise i look to hedge.
Trading Rules
1. Need a new high or low of the day during london and US sessions
2. Then look for a reversal candle of this high or low of the day
3. Need to see price near, bouncing off, spiked or a fake break of a round number
4. EU only traded after the 1st hour of euro session
5. GU only traded after the 1st hour of london session
6. Entry must trigger on next candle or trade is to be canceled
7. Require space for trade.. in other words room to the next round number
8. Break even on first reversal candle and let trade run
9. If a reversal after entry, hedge the trade in oposite direction, locking in a 1:1 once closed past
10. Lock in a 1:2 profit once a 1:3 has been hit and let trade run locking in profit
11.Lock in profit once a 2nd reversal candle, but giving trade still room to move
I've finally had a little time to post this method, sorry about the delay. First off let me say this is not my method and I have learnt this from another trader. I am going to show you the basics of how to trade this method and what to look for with both EU and GU charts from last weeks trading. Now this is a day trading method and requires your attention from 8am London open until end of the day New York close if you are holding trades this late into the day. Some trades will be left over night but mainly are closed out the same day. We only trade these 2 pairs as they are the most active during these hours.
This method will required for you to hedge your position on some trades, this means we have tried to sell or buy at the low or high of the day and have got it wrong and price reverses against our entry. Here we are looking to recover our loss at best and get some profit along the way. In most cases you win more on your hedge position than your losing trade. But with every thing forex there is a risk of having both trades stopped out, which has happend a couple of times to me.
So we mark the high and low of the asian session range and look for price to make a new high or low of the day with a opposite candle. We are then looking for price to make a new high or low in the opposite direction for a profit, but on some occasions this will need to be hedged if we dont have the high/low of the day.
Once in a trade on the first reversal candle if in profit we move our stop to break even to protect the account. Then let the profit run and lock in more as price moves. I will leave this up to you how you manage your take profit targets, either a fixed or let it run. I personally will lock in a 1:2 as soon as a 1:3 has been hit and let the trade run.
Below are trades from last week using this method, any questions just let me know.
joffie
Added rule that I use is not to trade into or touching a round number, the best trades come when traded with room or bouncing off or near a round number . If I now trade near a round number I will move to break even once hit or breached rather then waiting for a reversal candle if in profit of course, other wise i look to hedge.
Trading Rules
1. Need a new high or low of the day during london and US sessions
2. Then look for a reversal candle of this high or low of the day
3. Need to see price near, bouncing off, spiked or a fake break of a round number
4. EU only traded after the 1st hour of euro session
5. GU only traded after the 1st hour of london session
6. Entry must trigger on next candle or trade is to be canceled
7. Require space for trade.. in other words room to the next round number
8. Break even on first reversal candle and let trade run
9. If a reversal after entry, hedge the trade in oposite direction, locking in a 1:1 once closed past
10. Lock in a 1:2 profit once a 1:3 has been hit and let trade run locking in profit
11.Lock in profit once a 2nd reversal candle, but giving trade still room to move
Attachments
-
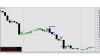 EU SELL 21-9-2015.png27.7 KB · Views: 248
 -
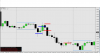 EU BUY AND HEDGED SELL 22-09-2015.png28.8 KB · Views: 203
 -
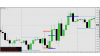 EU SELL AND HEDGED BUY 23-09-2015.png38.3 KB · Views: 180
 -
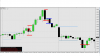 EU SELL AND HEDGED BUY 24-09-2015.png32.2 KB · Views: 150
 -
 EU BUY SET-UP STOPPED BREAK EVEN 25-09-2015.png32.2 KB · Views: 160
 -
 GU SELL AND HEDGED BUY 21-09-2015.png28.2 KB · Views: 145
 -
 GU BUY AND HEDGED SELL 22-09-2015.png27.9 KB · Views: 155
 -
 GU SELL STOPPED OUT 23-09-2015.png30.1 KB · Views: 145
 -
 GU SELL STOPPED OUT AND 2ND SELL 24-09-2015.png38.8 KB · Views: 141
 -
 GU MISSED SELL AND STOPPED OUT BUY 25-09-2015.png34.8 KB · Views: 138
Last edited: