
You are using an out of date browser. It may not display this or other websites correctly.
You should upgrade or use an alternative browser.
You should upgrade or use an alternative browser.
Chart Setup
- Thread starter ifykris
- Start date
TheForexGuy
Forex Mentor
they are peoples own personal chart preference, you would need to ask them directly.
erebus
TFG Forum Legend
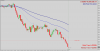
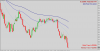
I have now switched to 100, 50 and 20 because I am only trading with the trend, so looking for 3 to 1 profits; hopefully in the trade a few days longer than some DnB trades using the 10.
My definition of trend is when both the Weekly and Daily are in the same direction using the EMA's mentioned; see these charts.
Looking for Price Action entries on pullback, of course
My definition of trend is when both the Weekly and Daily are in the same direction using the EMA's mentioned; see these charts.
Looking for Price Action entries on pullback, of course
Attachments
TheForexGuy
Forex Mentor
40/100 EMAs mimic the 10/20 emas on the daily chart. Those values wont work on the timeframes in between, you will have to do your own experimenting there to try come up with a close match. It could be calculated mathematically but I don't know how to - the math would be complex.
Last edited: